

Multi-Disciplinary Solutions: Examples

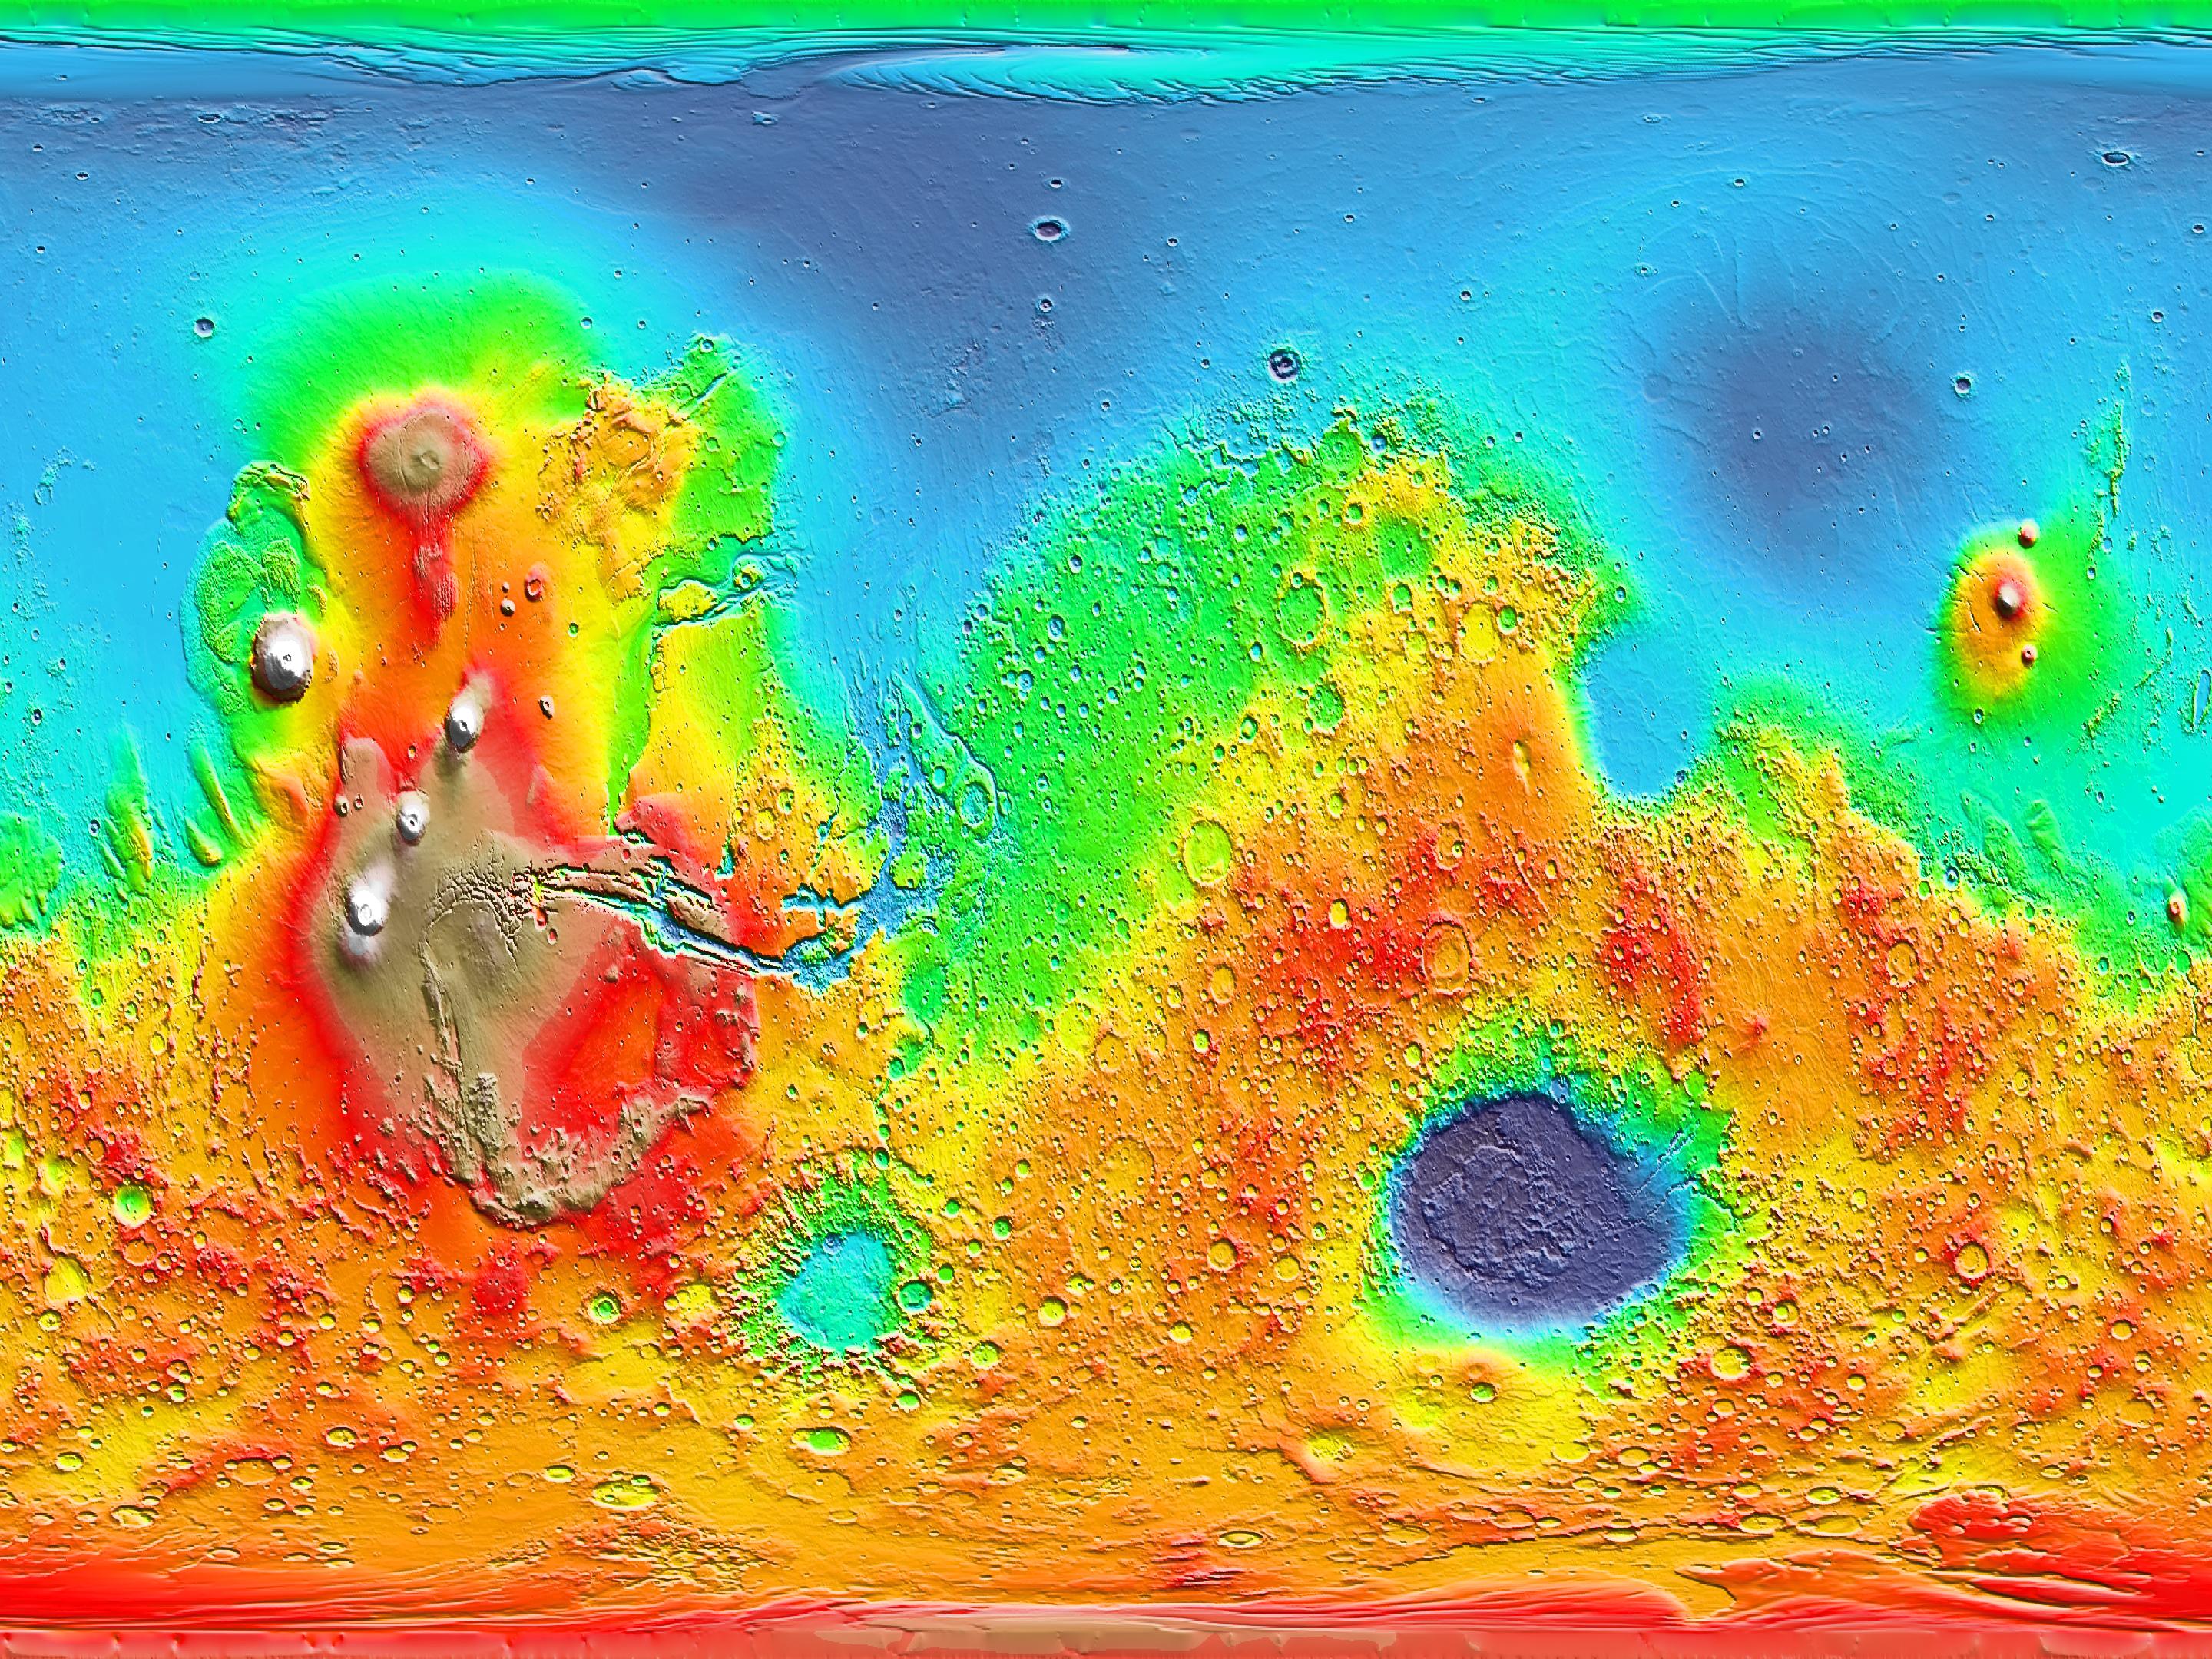
Environmental Shaded Relief Map of a former drilling pipe storage and cleaning facility
Used petroleum drill pipes contain deposits that tend to concentrate levels of radioactive scale, like calcium deposits on the inside of a pot when boiling water.
The client wanted to know if these concentrations were significant or presented an environmental hazard over a large area where the pipe was cleaned. They had taken nearly 1 million soil radioactivity readings on the site. Multiple consultants had already looked at these data and were unsuccessful at coming to any meaningful conclusions. A contour map of the data showed little variance and no discernible patterns, other than a few elevated concentrations.
By asking questions on what are expected soil background radiation levels and validating these concentrations with current analyses, it was discovered that the data contained an immense amount of “noise”. The revealing trends or higher radioactivity were visualized via some very clever use of multiple color scales and shaded relief in a Geographic Information System (GIS) application. The result: a pattern showing worker movements or work habits that demonstrated how and where radioactive pipe scale had entered the soil to cause these elevated concentrations.
Petroleum reservoir characterization
A great deal of money was spent collecting and processing 3D seismic data in a remote area of the world under hostile environmental conditions. An oil company, who purchased the rights to these data, could not clearly differentiate the channel sand deposits believed critical to finding a large oil deposit. The best resolution achievable from these data was thought to be on the order of 100 feet vertical resolution. Zones of even poorer resolution was peppered throughout the seismic data.
By asking the right questions regarding exactly how these seismic data were collected and overlaying the survey with high resolution aerial photography, it was discovered that the areas of poor seismic resolution, deep within the earth, corresponded to numerous surface lakes. Subsequently, the seismic data was color processed using technology invented by satellite imaging experts and applied in an advanced 3D geological modeling app. The result: a resolution of close to 10 feet revealed a well-defined channel where a large deposit of oil could be trapped. The same analyses were used to define oil-water contacts from seismic data more economically than ever believed possible!
